Copy These! 5 Big Local Ideas About Using Decentralised Energy
Communities around the UK are generating their own electricity - through solar, hydro and wind. But how can they ensure this power stays local?

Smart-grid connected Ventonteague wind turbine.
1. Grid and bear it.
The energy system in the UK is outdated – set-up at a time when energy flowed in one direction only, from big power plants, through district network operators (DNOs) and into homes. Now, with the dramatic rise of local electricity generation; both at a domestic and community level, the system is having to cope with two-way energy flow. Surely, it would be beneficial for everyone, therefore, to reduce pressure on the National Grid by allowing localised “micro-grids” to operate, distributing electricity in a smaller geography?
So far, progress towards this solution is very slow. There are a few hyper-local pilot projects around the UK where this is being demonstrated, including the Cornwall Local Energy Market (LEM) which, since 2021 has included generation from the Ventonteague wind turbine. This smart grid helps to manage demand by incentivising people to use more energy when generation is high, and less energy when there is limited capacity in the system. There is huge potential for systems like this to be rolled out in other areas, so that we can all benefit from a more reliable, more affordable and more sustainable energy future!
2. Batteries will get you everywhere…
Solar power is brilliant, and can lower bills and carbon emissions dramatically for those with access to systems. However, the time when we use the most energy is often not when the sun is shining. To avoid losing out on the electricity generated, and to reduce reliance on energy pulled from the grid, energy storage in the form of batteries is a vital part of any decentralised energy system. In Lancashire, Together Housing Trust has been implementing the large-scale use of solar photovoltaic panels with battery storage technology in retrofitted social housing properties. The project is not only acting as a demonstrator for other social housing developments across the UK, but is helping to engage a diverse group of residents with the benefits of renewable energy.

3. Everybody needs good neighbours!
Did you know that if you have solar panels or another form of electricity generation on your property, and you don’t use everything you generate, you can choose to share the excess with your neighbours? There are now several peer-to-peer energy suppliers which help those that generate connect with those that want to buy local energy. Read more about this, alongside other useful information and examples of projects using decentralised energy on our Big Local Action page.
4. Tell the decentralised story.
As Sir David Attenborough famously said, the climate crisis is now a challenge of communication. As we’ve heard from many of the people we have spoken to for the 25 Big Local Actions campaign, getting the story of the action out is sometimes equally, if not more important than the action itself. This is very much the case for Hilary Powell and Dan Edelstyn, the artists behind Power Station. The pair started their project in 2020, with the idea to create a whole street of houses that could generate its own electricity, and to document the process of implementation through a film, which was released into cinemas in autumn this year (2025). Hilary spoke to us on the Carbon Copy Podcast, and told us some of the story behind the project and why creating the film was a crucial part of the journey.
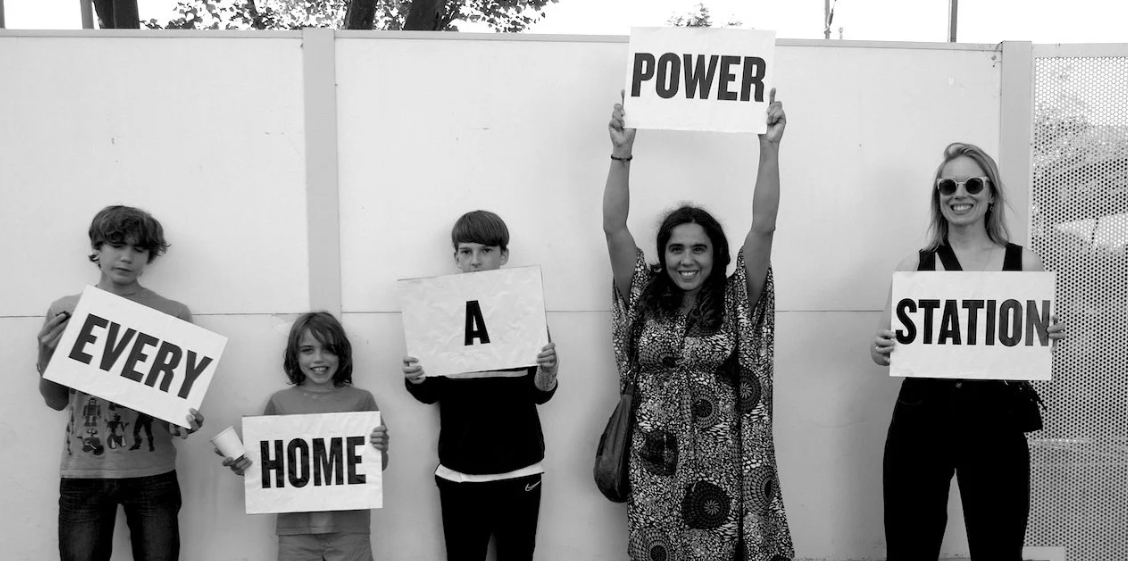
“Every Home A Power Station” Credit: Power Station
5. Join the club!
Energy Local is a Community Interest Company, which has designed a local market in power via Energy Local Clubs. These clubs enable households to join together to show when they are using local clean power when it is generated. The scheme gives generators a price for the power they produce, that reflects its true value, keeps more money local and reduces household electricity bills.
Learn more about setting up or joining an Energy Local Club where you are.
Use Decentralised Energy is the latest focus in Carbon Copy’s 25 Big Local Actions in 2025 campaign. For more information about this and to discover a local action that’s right for you, visit our campaign landing page.
Recommended from Carbon Copy
-
 Affordable Energy, Buildings & Places, Climate Action, Good Food, Greater Fairness, Health & Wellbeing, Less Waste, More Jobs, Strong Communities
Copy These! 5 Big Local Ideas About Creating A Community Hub
Learn how communities are reinvigorating once-forgotten spaces, to bring local environmental, social and economic benefits.
-

How to Choose a Sustainable Christmas Tree: Real vs Fake
As you’re gearing up for the festive season, the question of which Christmas tree to bring home might come up.…
-

A More Circular Christmas: Affordable, Sustainable and Shared
Christmas is a time when many families gather, share food, exchange gifts and enjoy the festive spirit. But it is…
-
Positive Advertising About The Climate Crisis
Is our glass half full or half empty? Unfortunately, negative news cycles encourage us to look at what’s not there;…